Climate Equity and Vulnerable Communities
Learn about vulnerability to climate change and the ICARP Vulnerable Communities Platform.
Learn about vulnerability to climate change and the ICARP Vulnerable Communities Platform.
To reduce the potential risks of climate change, we must increase communities’ ability to adapt to climate change and recover from climate-change-related disruptions. Some communities are better positioned to adjust and recover than others. Historic disinvestment has caused low-income Black, Brown, Indigenous, and other marginalized communities to experience disproportionate climate impacts and limits climate adaptation ability.
Inequities stemming from institutionalized racism, environmental pollution, underinvestment, and exclusion from services and opportunities have made non-white communities with low incomes more likely to have substandard living conditions and chronic health or mental illnesses. These factors not only increase a community’s vulnerability to the impacts of climate change but also reduce their ability to adapt.
The Vulnerable Communities Platform (VCP) is a new website and mapping tool created by the Governor’s Office of Land Use and Climate Innovation to help identify California communities most vulnerable to the impacts of climate change. The platform will provide a broad overview of a community’s vulnerability, helping to pinpoint key challenges that can be addressed with actions to improve resilience.
The VCP will help community organizations, local governments, and concerned residents understand where different climate hazards will be most severe, which communities are most vulnerable, and what makes them vulnerable.
The platform is now publicly available at Vulnerable Communities Platform. Take a look to learn more, access resilience related data and resources, and sign up for upcoming webinars.
What is a Vulnerable Community?
In 2018, the ICARP Technical Advisory Council defined the term “vulnerable communities” to clarify the many factors that affect communities’ climate adaptation and resilience and to help inform State climate adaptation efforts. To learn more about the Council’s vision for a resilient California and seven principles for achieving resilience, explore the ICARP Council Vision and Principles page.
ICARP Definition of the term “Vulnerable Communities”
Climate vulnerability describes the degree to which natural, built, and human systems are at risk of exposure to climate change impacts. Vulnerable communities experience heightened risk and increased sensitivity to climate change and have less capacity and fewer resources to cope with, adapt to, or recover from climate impacts. These disproportionate effects are caused by physical (built and environmental), social, political, and/or economic factor(s), which are exacerbated by climate impacts. These factors include, but are not limited to, race, ethnicity, class, gender, sexual orientation, national origin, income inequality, and disability. People facing multiple forms of marginalization and inequality will confront more intense climate change impacts and barriers to recovery.
To help climate adaptation practitioners identify climate vulnerable communities and define the term, ICARP staff developed a resource guide with input from the Technical Advisory Council.
The Vulnerable Communities Platform
The Vulnerable Communities Platform (VCP) is a new interactive tool to help identify and support California communities most impacted by climate change related extreme heat, flooding, sea level rise, drought and wildfire.
The platform was designed to help the state, community organizations, local governments, and concerned residents understand where different climate hazards will be most severe, which communities are most vulnerable, and what factors contribute to that vulnerability
Explore the platform at vcp.lci.ca.gov
How can the Vulnerable Communities Platform be Used?
We have developed a series of User Guides with detailed, step-by-step guidance on how to use the Vulnerable Communities Platform for state agencies, community organizations, and local governments.
For state agencies:
The VCP’s Vulnerability Map can help program administrators identify the specific climate vulnerabilities in areas they are working in and determine where outreach or funding should be focused. For example, the VCP is included as one of the tools recommended to help understand a population’s climate vulnerability in the 2024 Climate Bond implementation guidance.
For community based organizations:
The VCP’s Vulnerability Map provides data, maps, and information to help tell the story of a community’s climate vulnerabilities in a grant application. The Resilience Resource Springboard can connect organizations to state, private, and federal funding sources as well as networks of other organizations involved in climate. In addition, the Help Desk offers one-on-one support from Climate Services staff for all phases of assessing climate vulnerabilities and developing adaptation strategies.
For local governments:
The Vulnerability Map offers a broad overview of a town, city, or county’s climate vulnerabilities to get started in the process of fulfilling local planning requirements. The Climate and Environmental Data Resources page provides access to more detailed data sources for deeper analysis.
Click the button below to learn more about all the different features available on the platform.
Climate Vulnerability Map
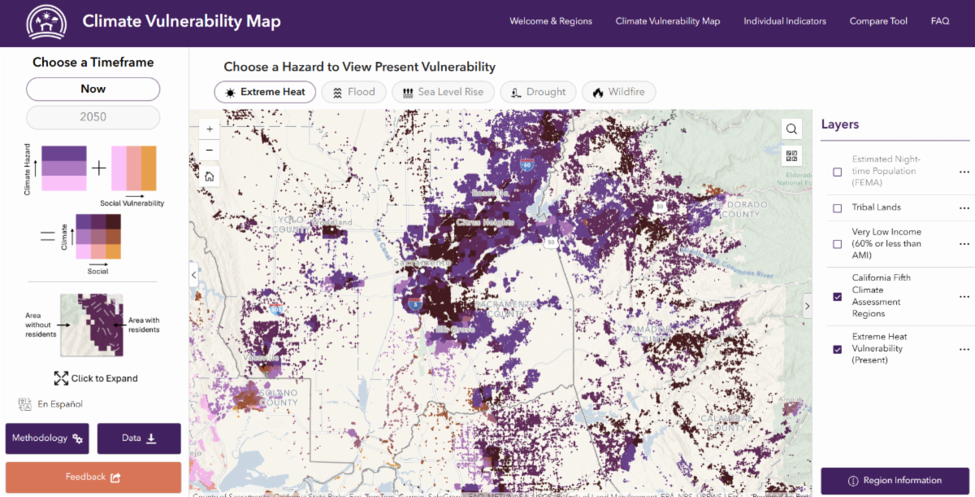
The Climate Vulnerability map shows areas with relatively low, medium, and high vulnerability to extreme heat, sea level rise, flooding, and drought- both under current conditions and projected for 2050.
For each hazard, the map looks at the intersection of climate hazard data and social vulnerability data to identify areas that should be prioritized for adaptation action.
We use the best available climate and environmental data to represent climate hazards, including climate projections from Cal-Adapt and environmental data from various California state agencies. Social vulnerability data comes primarily from the US Census and the CDC Places Survey. Read more about the data and methods used in our methodology report.
Guidance and Comparison of Other Vulnerability Tools
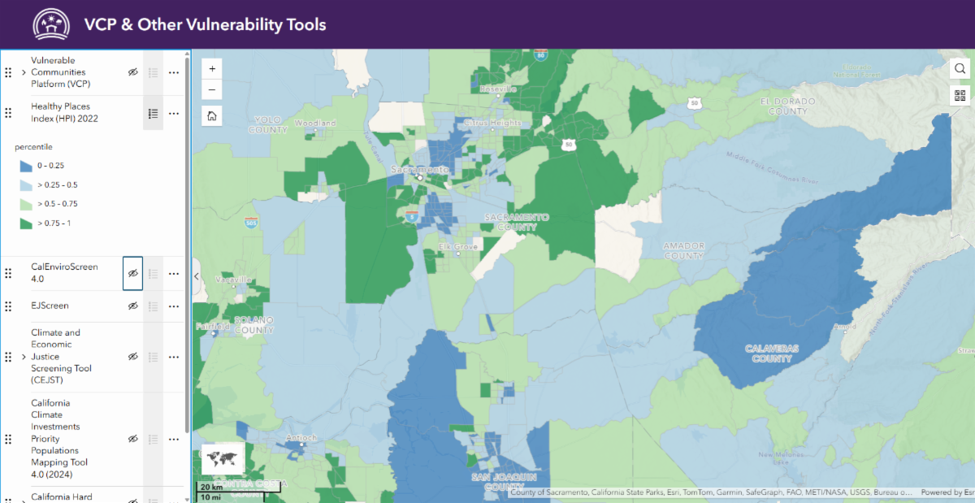
The VCP was developed to fill a gap in the climate resilience space as there previously was no California-specific tool offering a comprehensive overview of the major climate hazards.
Through the process of developing the VCP, we realized that there are a wide range of equity and disadvantage related tools and many people were interested in guidance on how and when these different tools could be used. The Other Vulnerability Tools page on the VCP provides quick summaries of the parameters of these different tools including what kind of data they offer, at what scale, and what use cases they are best for. The page’s map feature also allows users to overlay data from multiple tools for easy comparison.
Climate and Environmental Data Resources
The Vulnerability Map provides mapped, high level view of vulnerability to major climate hazards. However, for those who are interested in digging more into the details of the data for specific hazards, there are a wide variety of data sources related to extreme heat, wildfire, flood, sea level rise, health, and environmental justice. It can be difficult for users to parse through these data sources and understand what kind of information they can find where. The Climate and Environmental Data Sources page breaks down the specific data available at each source to help people compare and understand what they need.
Resilience Resources
In the process of developing the VCP, we heard from local governments, community orgs, and others that they needed better access to resources to get started in adaptation planning. The Resilience Resources page compiles links to helpful resources , including links to all the major federal, state, and private grant search tools, major planning requirements related to climate adaptation, and ways to connect to other community-based organizations and regional collaboratives working on climate resilience.
Climate Data Viewer
The VCP’s Climate Data Viewer displays climate projections data for current and 2050 conditions from California’s Fifth Climate Change Assessment. The viewer shows a set of 5 – 6 easy to understand climate metrics for extreme heat, flooding, drought, wildfire, and sea level rise. For example, for extreme heat, metrics include the temperature of the hottest day of the year, the number of days over 90° and 100°, and the seasonal timing shift of the first 100° day.
VCP Report Generator
Report Generator creates a PDF document with a complete breakdown of climate and social data for a selected block group, tract, zip code, or cities / town / unincorporated area under a population of 100,000. The report provides the high / medium / low designation for the area for each climate hazard, regional context, specific values and percentile ranks for each social and climate indicator, and demographic charts of the area including income, race, and language. While the VCP’s existing Climate Vulnerability Map allows you to look at the distribution of climate vulnerability across the state, the Report Generator gives you a complete summary for a specific area without having to look at a map at all! Below is an example four-page report for a zip code in Sacramento.
Follow the steps below to use the tool:
1) Select a scale (block group, tract, zip code, or cities / town / unincorporated area).
Remember that reports can only be generated for geographies with a population under 100,000. This means that for some larger cities (like Los Angeles or San Francisco) you will need to select a smaller scale, like a zip code.
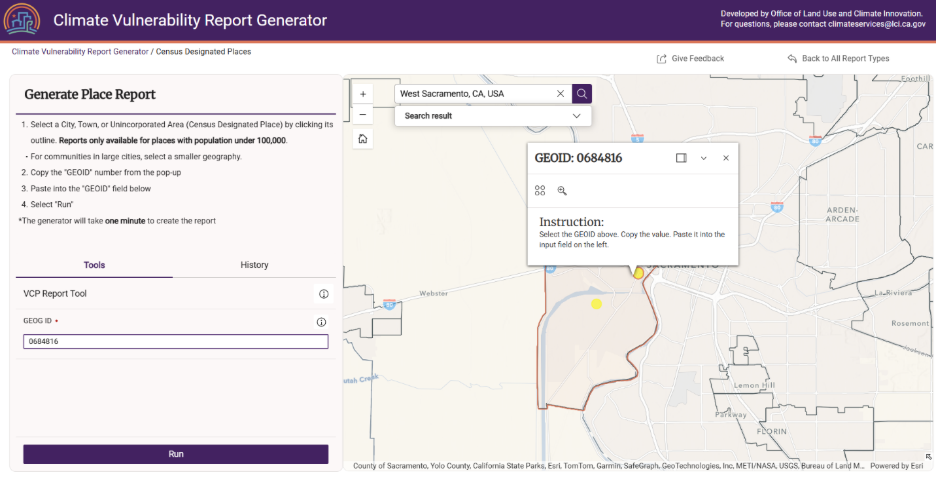
2) Use the search bar in the map to zoom in to the area you are interested in. Then, click on the spot and copy the GEOID number into the generator on the left side of the screen,
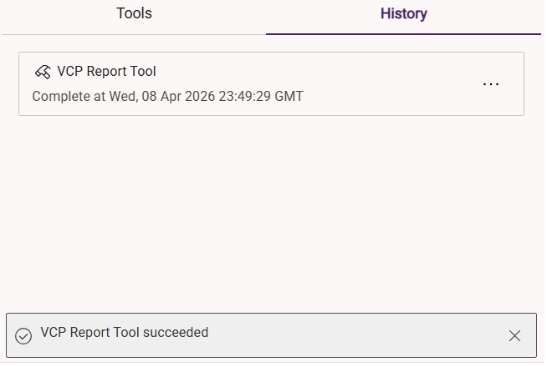
3) The report will take about a minute to generate and once complete, it will be available to view and download.
What’s Ahead for the VCP?
The release of this platform is not the end, it is just the beginning. The VCP will be entering a phase of outreach, feedback gathering, and implementation.
We’d love your help spreading the word! If you can share the VCP in upcoming newsletters, listservs, meetings, webinars, or conferences, please contact us at climateservices@lci.ca.gov.